Friday, April 17, 2020
Python and math
Way back in college I was studying vector calculus.. the calculus of several variables and deal with functions like z = f(x,y).
One could graph it... using that Mathematica in the computer lab and back then only the experts (graduate students) know how to use it. Math software such as Mathematica and Matlab are there for a long time only academic research folks ever need to use them. I don't ever need to get my hands on it. My statistic knowledge is minimal... (3 quarters of mostly forgotten probability and statistics in college)
I studied some computer graphics... learned linear algebra tricks of collapsing 3D to 2D. That stuff I wouldn't call exactly easy. See here for a taste of it.
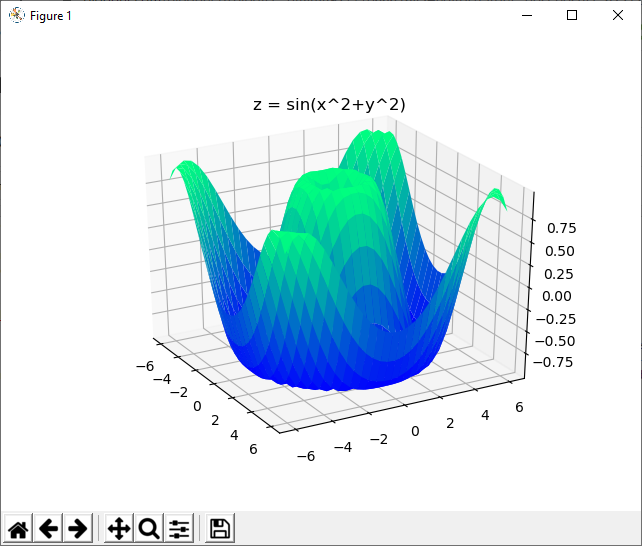
Python readily have this available with its Matlab package... and in just a few lines, I am able to make a 3D graph.
See https://towardsdatascience.com/an-easy-introduction-to-3d-plotting-with-matplotlib-801561999725. I can even drag window around to see the graph in every angle!
This. is. neat.

Subscribe to:
Post Comments (Atom)
No comments:
Post a Comment